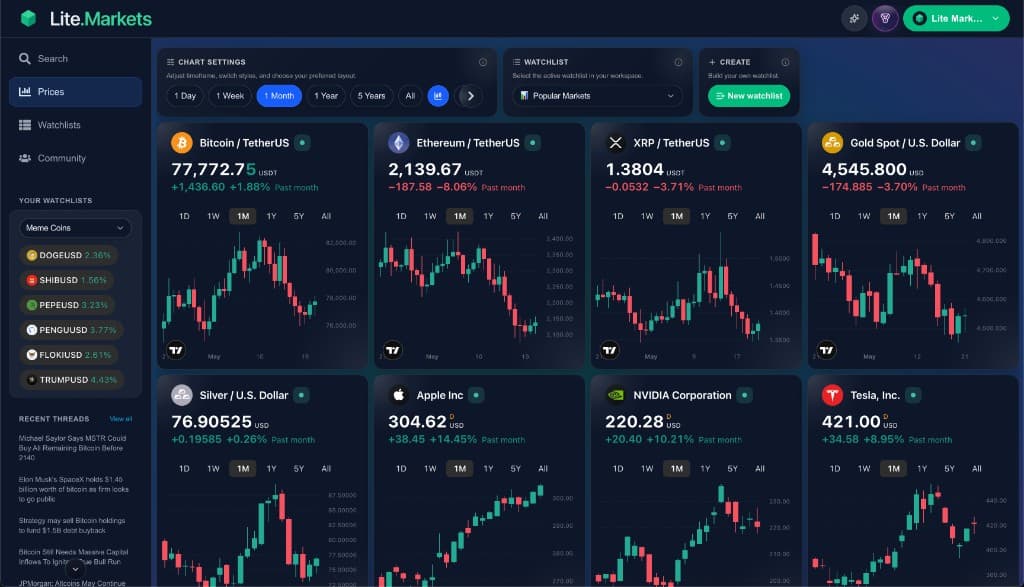
Live prices & watchlists
Tracking markets
without the noise
without the noise
Crypto, stocks, and precious metals
in a simple, distraction-free interface.
in a simple, distraction-free interface.
Lite.Markets gives you live prices, watchlists, and clean market dashboards. It is free to use, and creating an account is free.
Bitcoin and chart trading terms — plain-language definitions
Use this A–Z reference to familiarize yourself with chart, market-structure, and Bitcoin terms in plain language — support and resistance, necklines, breakouts, timeframes, halvings, and more.
Definitions below reflect how traders and chart tools commonly use each term. They are not buy or sell signals. Educational reference only — not financial advice.
Pair terms with our chart patterns guide, Bitcoin price chart, or Timeframe Trends to see ideas in context.
Chart patterns
- Neckline
- In head-and-shoulders or double-top/bottom setups, the line connecting the lows (or highs) between the pattern’s main swings. A break through the neckline is a common confirmation signal.
- Reversal pattern
- A shape that often appears after an extended trend and may signal a change in direction — e.g. head & shoulders after a rally, or inverse H&S after a decline.
- Continuation pattern
- A brief pause within an existing trend. Bull flags, pennants, and ascending channels are examples where the prior trend may resume after the pattern completes.
- Head & shoulders
- Three peaks with a higher middle peak (the head) and two lower shoulders. A break below the neckline is often treated as bearish in classical technical analysis.
- Double top
- Two peaks at similar price with a valley between. Traders often watch for a break below that valley as a potential bearish trigger.
- Double bottom
- Two troughs at similar price with a peak between. A break above the intervening peak (neckline) is a common bullish interpretation.
- Bull flag
- A sharp rally (flagpole) followed by a small downward-sloping channel. Often read as a pause before a potential continuation higher — not a guarantee.
- Bear flag
- A sharp decline followed by a small upward-sloping channel. Often read as a pause before a potential continuation lower.
- Wedge
- Price compresses between two converging trendlines. Rising wedges are sometimes watched for bearish resolution; falling wedges for bullish — context matters.
- Triangle
- Price squeezed between converging lines. Ascending, descending, and symmetrical triangles can break either way; direction often follows the winning break.
- Doji
- A candlestick with open and close nearly equal — a small or absent body. Often read as indecision; the next bar’s direction may matter more than the doji alone.
- Hammer
- A candle with a small body near the top and a long lower wick. Traders often discuss it after a decline as a potential bullish reversal hint — confirmation still required.
- Engulfing pattern
- A two-candle setup where the second body fully wraps the first — bullish engulfing after a red bar, bearish engulfing after a green bar. Shows a sharp shift in who controlled the close.
- Morning star
- A three-candle bullish reversal discussion: large bearish bar, small indecision star, then a strong bullish bar closing into the first body. Context and volume still matter.
- Channel
- Price moving between two parallel trendlines — ascending, descending, or horizontal. Traders often watch for breaks outside the channel or bounces from its edges.
- Pennant
- A small symmetrical triangle after a sharp move (the flagpole). Like flags, pennants are often read as brief consolidation before a possible continuation in the prior direction.
Market structure
- Support
- A price level where buying interest has repeatedly appeared, slowing or reversing a decline. Traders watch for holds at support or breaks below it.
- Resistance
- A price level where selling pressure has repeatedly capped rallies. A clean break above resistance is often read as bullish; rejections can signal exhaustion.
- Breakout
- When price closes beyond a defined boundary — support, resistance, trendline, or pattern edge — often with increased volume. False breakouts (quick reversals back inside) are common.
- Consolidation
- A period of sideways or range-bound price action after a move. Flags, triangles, and rectangles are consolidation patterns that may resolve with continuation or reversal.
- Trend
- The prevailing direction of price — higher highs and higher lows (uptrend) or lower highs and lower lows (downtrend). Channels parallel trendlines.
- Pullback
- A temporary move against the dominant trend. Trend traders sometimes treat pullbacks to support as potential re-entry zones — with defined invalidation.
- Higher high
- A peak above the previous peak in an uptrend. Together with higher lows, higher highs define bullish market structure on the timeframe you are viewing.
- Lower low
- A trough below the previous trough in a downtrend. Together with lower highs, lower lows define bearish market structure.
- Trading range
- Price oscillating between clear support and resistance without a sustained trend. Breakouts from ranges can lead to sharp moves; false breaks are common inside choppy ranges.
- Retest
- Price returning to a level that was recently broken — e.g. old resistance tested as new support after a breakout. Holds on retest can confirm the break; failures can invalidate it.
- Liquidity
- How easily an asset can be bought or sold without moving price much. Thin liquidity can exaggerate wicks and slippage; deep markets usually absorb orders more smoothly.
- Gap
- A visible jump between one period’s close and the next open with no trading in between. Crypto markets trade 24/7, so gaps are less common than on traditional stock charts but can appear on some aggregated feeds.
- Swing high
- A local peak surrounded by lower highs on each side — a turning point traders use to map structure, draw trendlines, or anchor pattern recognition.
- Swing low
- A local trough surrounded by higher lows on each side. Swing lows help define support, trend direction, and pattern boundaries.
Analysis & risk
- Timeframe
- The interval each candle represents — e.g. 15 minutes, 4 hours, daily. Patterns on higher timeframes usually span longer and carry more weight for macro context.
- Candlestick
- A bar showing open, high, low, and close for a period. Green (or white) typically means close above open; red means close below open.
- Volume
- The amount traded in a period. Breakouts on rising volume are often considered stronger confirmation than moves on thin volume.
- Moving average
- A smoothed line of past prices over N periods (simple or exponential). Price above a rising MA is often read as bullish context; crossovers and distance from the MA are common cycle tools on BTCGoTo.
- Stop loss
- A predefined exit if price moves against you — limiting loss on a trade idea. Placing stops requires accepting that normal volatility can trigger them before a setup works.
- Risk-reward ratio
- Compares potential profit to potential loss on a trade (e.g. risking $100 to target $300 is 1:3). Useful for planning, not a guarantee that either outcome will occur.
- Divergence
- When price makes a new high or low but an indicator (e.g. RSI) does not confirm. Some traders treat divergence as early warning of weakening momentum — it often fails in strong trends.
- Overbought
- A stretched-up condition on an oscillator or rapid rally — sometimes associated with pullbacks, but strong trends can stay overbought for extended periods.
- Oversold
- A stretched-down condition — sometimes associated with bounces, but bear markets can remain oversold while price keeps falling.
- Volatility
- How much price swings over time. Bitcoin is historically volatile; wider stops and smaller size are common responses to high-volatility regimes.
- Drawdown
- The decline from a peak to a subsequent trough — e.g. “−30% from the high.” Cycle charts and bear-market pages on BTCGoTo track historical drawdowns for context.
- Position sizing
- How much capital you allocate to a trade relative to account size and risk. Smaller size in uncertain or volatile conditions is a common risk-management habit.
- Fibonacci retracement
- Horizontal levels (often 38.2%, 50%, 61.8%) drawn between a swing low and high. Traders watch for reactions at these ratios — they are guides, not magic numbers.
- Confirmation
- Extra evidence that a setup may be valid — e.g. a breakout with volume, or a close beyond a neckline. Reduces false signals but never eliminates them.
- Invalidation
- The price level or condition that would prove a trade idea wrong — e.g. a bull flag failing if price closes below the flag low. Useful for risk planning, not prophecy.
- Bullish
- Bias expecting higher prices. A pattern labeled bullish suggests traders often watch for upside resolution — markets can still fail the setup.
- Bearish
- Bias expecting lower prices. Bearish patterns or breaks are read as potentially negative — not automatic sell signals.
Bitcoin context
- Halving
- Bitcoin’s programmed reduction in new supply issuance roughly every four years. Often discussed alongside cycle charts; price does not follow a fixed script.
- Market cycle
- Recurring phases of expansion and contraction in Bitcoin’s history — bull runs, drawdowns, and accumulation. Tools like the 200-week MA and halving countdown add macro context.
- On-chain
- Data recorded on the Bitcoin blockchain — addresses, transactions, hashrate, etc. Complements price charts for network activity, separate from classical pattern trading.
- Satoshi
- The smallest unit of Bitcoin — 100 million satoshis (sats) equal one BTC. Useful for thinking about small balances and fees without decimal-heavy BTC amounts.
- Block
- A batch of confirmed Bitcoin transactions added to the chain roughly every ten minutes on average. Each block includes a reward paid to the miner who found it.
- Mining
- The process of validating transactions and securing the network by expending computational work (proof of work). Miners compete to add blocks and earn block rewards plus fees.
- Hashrate
- Total computational power directed at Bitcoin mining. Rising hashrate generally signals more miners and network security; BTCGoTo charts hashrate alongside price for long-term context.
- Mempool
- The waiting area for unconfirmed transactions before they are included in a block. Congestion raises fees; empty mempools often mean cheaper, faster confirmations.
- UTXO
- Unspent transaction output — how Bitcoin tracks who can spend what. Wallets sum UTXOs to show your balance; each spend consumes UTXOs and creates new ones.
- Wallet
- Software or hardware that holds keys and builds transactions. A wallet does not store coins on a device — it controls access to UTXOs on the blockchain.
- Self-custody
- Holding your own keys instead of relying on an exchange or custodian. Full control also means full responsibility for backups and security.
- Seed phrase
- A human-readable backup (usually 12 or 24 words) that can restore a wallet’s keys. Anyone with the seed can spend the funds — never share it or store it online in plain text.
- Proof of work
- Bitcoin’s consensus mechanism: miners must find a valid hash below a target difficulty, making rewriting history prohibitively expensive. Distinct from proof-of-stake chains.
- Whale
- Informal label for entities holding very large Bitcoin balances. Large transfers can move sentiment or liquidity but do not by themselves predict short-term price.
- HODL
- Hold on for dear life — meme-turned-strategy for long-term holding through volatility instead of trading every swing. Not a risk plan by itself.
- Bull market
- An extended phase of rising prices and optimistic sentiment. On BTCGoTo, bull-market pages define cycles from prior all-time high breaks to the next peak.
- Bear market
- A prolonged decline from cycle highs to the next major low — often −50% or more in Bitcoin’s history. Bear-market charts help compare depth and duration across cycles.
- 200-week moving average
- A long-term simple moving average (~1,400 daily closes) widely watched in Bitcoin macro analysis. Price far below it has often coincided with deep drawdowns; far above with late-cycle euphoria.
- Stock-to-flow
- A scarcity model relating existing supply to new issuance. BTCGoTo’s Stock-to-Flow chart overlays model paths by halving epoch — educational, not a price oracle.
- Pi Cycle Top
- An indicator comparing a 111-day MA to twice the 350-day MA. Historical crossovers have lined up with major cycle tops — past performance does not guarantee future signals.
- Lightning Network
- A layer built on Bitcoin for faster, lower-fee payments by settling net balances on-chain periodically. Used for spending-sized transfers rather than cold-storage savings.
- Block reward
- New bitcoin issued to the miner of each block, cut in half at every halving. Declining issuance is a core part of Bitcoin’s supply schedule toward 21 million coins.
- Difficulty adjustment
- Bitcoin retargets mining difficulty every 2,016 blocks so average block time stays near ten minutes. Rising difficulty with rising hashrate keeps issuance predictable.
- Exchange inflow
- Coins moving onto exchanges — sometimes interpreted as potential sell pressure, though flows can also reflect internal transfers or trading desk operations.
- Realized cap
- An on-chain valuation using the price when each coin last moved, rather than spot price. Often discussed in advanced cycle analysis alongside market cap.
Educational reference only · Not financial advice · Back to Education hub